
It’s important to check your disk space periodically to see what parts of your website are taking up the most room, so you know where to compress or delete unnecessary files if you’re running out of space.
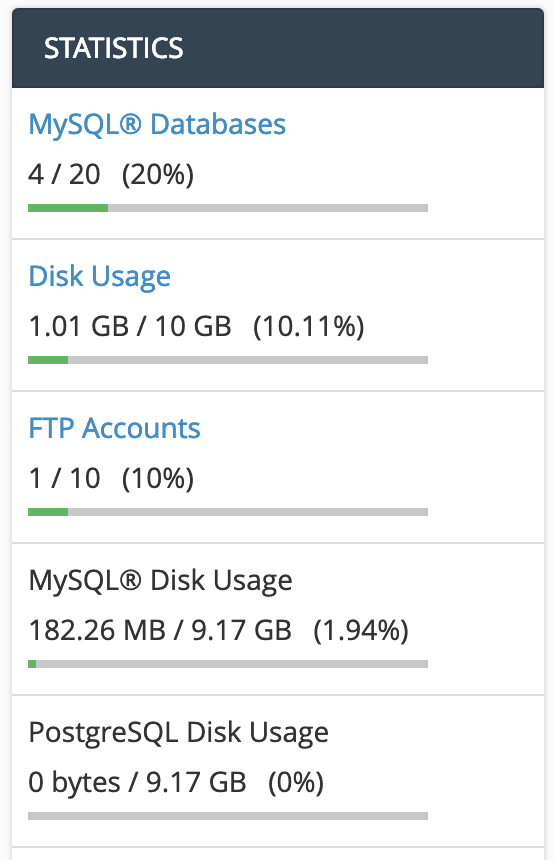
To get a general overview of your usage, just take a glance at the right sidebar of cPanel. You’ll see various info on how much disk space you’re consuming, how many databases you’ve set up in total, and more.
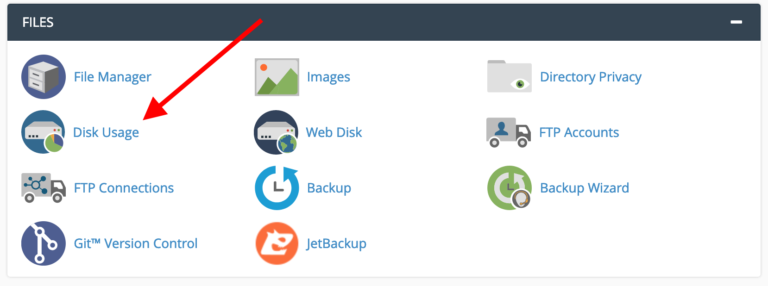
To get a more in-depth look, click on the “Disk Usage” icon from the “FILES” section.
What you’ll see is a nice summary of how much space your different folders are taking up.
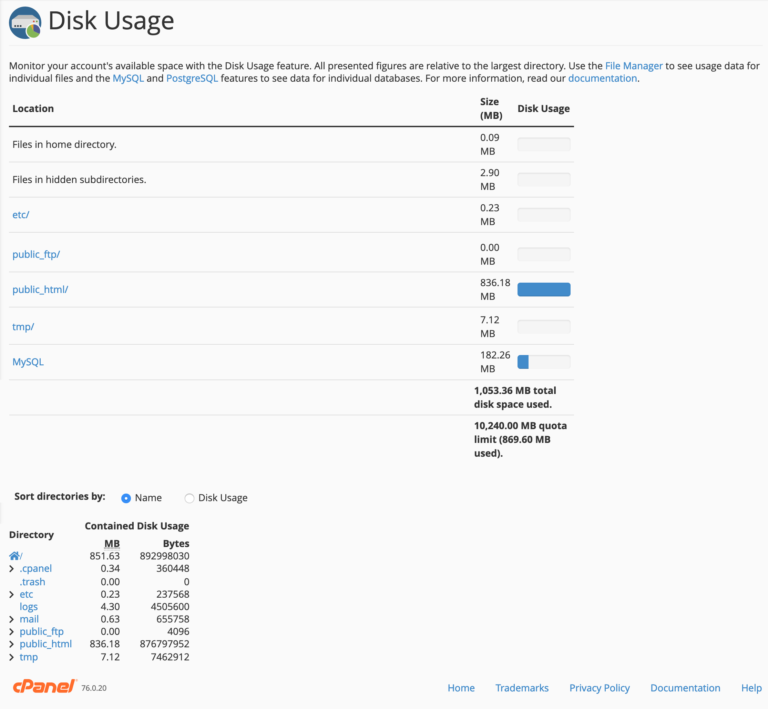
You can also see your quota or limit along the bottom of the first table – in this case, the quota in the image above is 10,240MB (or 10GB).
It’s important to note that just because a blue bar is full doesn’t mean you’ve used up all your space – all presented figures are relative to the largest directory.
Checking Your Stats
The final thing that’s worth a look as you’re going through cPanel is the section labeled “METRICS”.
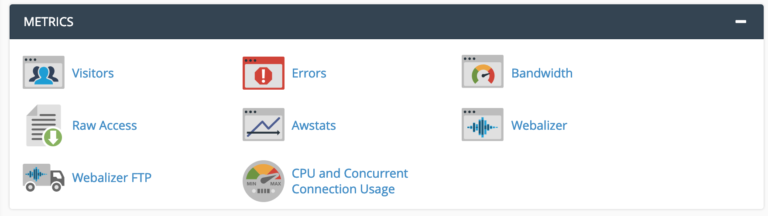
You can find a lot of interesting details there, all informing you about the current status of your server, the number of visits you’re getting and the overall health of the setup.
Each of these stats sections presents a slightly different take on your numbers:
- Visitors, Raw Access, Awstats, Webalizer all focus on the number of visitors your websites have been getting. The presentation varies between each of these sub-sections.
- Errors present the most recent entries in your website's error logs.
- Bandwidth allows you to see the bandwidth usage of your hosting setup.
- Webalizer FTP show you data on all visits through the FTP protocol.
- CPU and Concurrent Connection Usage shows you the volume of machine resources consumed by your hosting setup.
Follow the links in the right sidebar above (below if you're on your phone) in order to learn about cPanel.